
How can we help?
-
Asset
-
-
- Articles coming soon
-
- Articles coming soon
-
Facilities
-
Failures
-
- Articles coming soon
-
-
Group
-
Help
-
- Articles coming soon
-
- Articles coming soon
-
- Articles coming soon
-
- Articles coming soon
- Articles coming soon
-
-
Main Client Window
-
- Articles coming soon
-
- Articles coming soon
-
- Articles coming soon
-
- Articles coming soon
-
-
Scoreboard
-
- Articles coming soon
-
- Articles coming soon
-
- Articles coming soon
-
- Articles coming soon
-
-
Tools
-
-
- Articles coming soon
-
-
Window
-
- Articles coming soon
-
- Articles coming soon
-
- Articles coming soon
- Articles coming soon
-
Group History Graph Screen
Posted
Updated
ByTheta Team
Print Objective:
Explain what a user is seeing on the Group History Graph Screen.
Rights Needed:
☐Admin ☐ Admin Lite ☐Well Admin ☐Well Control
☐Well Config ☐Well Config Lite ☒Read Only
Versions:
XSPOC: 3.1, 3.2
Purpose:
The Group History Graph Screen displays total trended data for every asset in the group, for designated parameters.
Instruction:
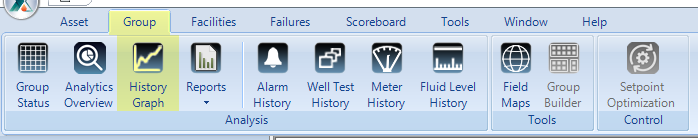
- Open the XPOC Client
- From the navigation panel locate and select the Group Tab
- Click Group Tab > History Graph Icon
- The Group History Graph Screen displays trended group data.
- On the top left of the screen there are three icons.
- Refresh – updates the data displayed in the graph area.
- Manage Views – opens a window that displays the available views for users with Admin rights.
- Overlay Graphs allows users to overlay multiple trends on the same X and Y axis.
- The Filter section contains three sections.
- Date Range – allows the user to select a specific date range of data to display in the graph area.
- Time Span – allows the user to specify the number of days and hours to display data for in the graph area.
- Apply – allow the user to apply the selected filter options
- The Trends area on the left contains two tabs.
- Trends – allows the user to select desired data trends on the graph from multiple folders.
- Graph – allows the user to add or remove graph areas within the graph plot area.
- On the bottom right there are two window control icons.
- The lock icon allows the user to lock the screen.
- The arrow icon allows the use to float the window and move it to other screens or areas of the same computer screen.
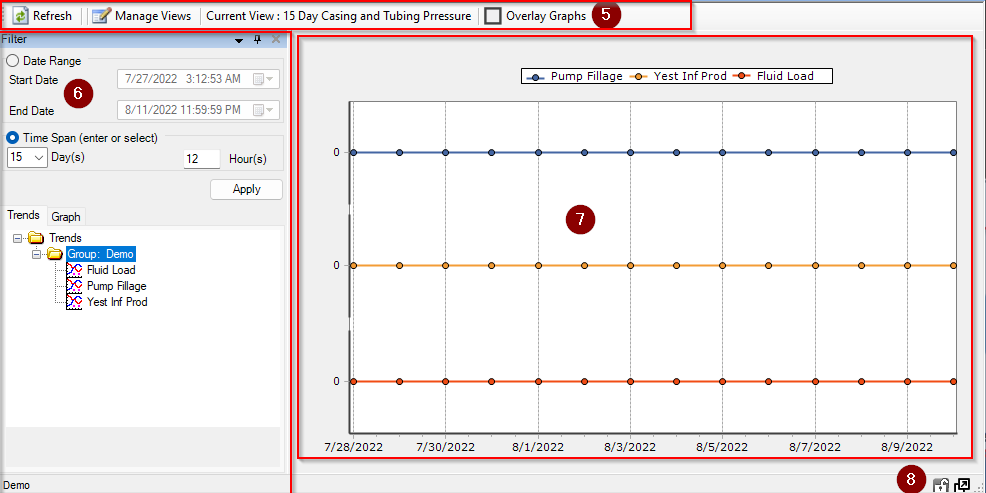
Table of Contents