
How can we help?
-
Asset
-
-
- Articles coming soon
-
- Articles coming soon
-
Facilities
-
Failures
-
- Articles coming soon
-
-
Group
-
Help
-
- Articles coming soon
-
- Articles coming soon
-
- Articles coming soon
-
- Articles coming soon
- Articles coming soon
-
-
Main Client Window
-
- Articles coming soon
-
- Articles coming soon
-
- Articles coming soon
-
- Articles coming soon
-
-
Scoreboard
-
- Articles coming soon
-
- Articles coming soon
-
- Articles coming soon
-
- Articles coming soon
-
-
Tools
-
-
- Articles coming soon
-
-
Window
-
- Articles coming soon
-
- Articles coming soon
-
- Articles coming soon
- Articles coming soon
-
Controller Trends Screen
Posted
Updated
ByTheta Team
Print Objective:
Explain what a user is seeing on the Controller Trends Screen.
Rights Needed:
☐Admin ☐ Admin Lite ☐Well Admin ☐Well Control
☐Well Config ☐Well Config Lite ☒Read Only
Versions:
XSPOC: 3.1, 3.2
Purpose:
Designed to give the user an overview of the Controller Trends Screen. The Controller Trends window allows you to view trends based on data stored in the Pump Off Controller (POC).
Instruction:

- Open XPOC Client
- From the navigation panel locate and select the asset
- Click Asset Tab > Controller Trends Icon
- The POC Trends window has a Controller Trends tab, and a Real Time Trends tab. a Valve Check tab, and a Plot Area.
- The Controller Trends tab allows you to view the historical data stored in the controller as trend lines in the plot area. This data is stored in the controller and not in the XSPOC database.
- The Real Time POC Trends tab allows you to view real time controller data as trend lines in the plot area. XSPOC will retrieve the desired real-time data at fixed intervals and will display the corresponding data in the graph. This data comes from the controller and is not stored in the XSPOC database or in the controller, so once the window is closed all data is lost.
- On the SAM controller only, a third tab appears which allows you to retrieve any Valve Check plots that have been stored in the controller. For these to be available, someone must save the plots at the well during a valve check operation.
- On the bottom right there are two window control icons.
- The lock icon allows the user to lock the screen,
- The arrow icon allows the use to float the window and move it to other screens or areas of the same computer screen.
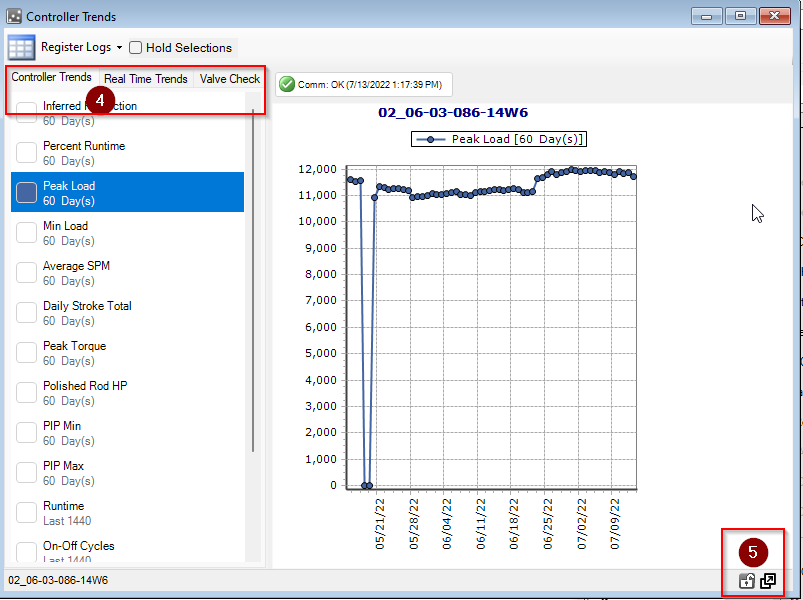
Table of Contents