
How can we help?
-
Asset
-
-
- Articles coming soon
-
- Articles coming soon
-
Facilities
-
Failures
-
- Articles coming soon
-
-
Group
-
Help
-
- Articles coming soon
-
- Articles coming soon
-
- Articles coming soon
-
- Articles coming soon
- Articles coming soon
-
-
Main Client Window
-
- Articles coming soon
-
- Articles coming soon
-
- Articles coming soon
-
- Articles coming soon
-
-
Scoreboard
-
- Articles coming soon
-
- Articles coming soon
-
- Articles coming soon
-
- Articles coming soon
-
-
Tools
-
-
- Articles coming soon
-
-
Window
-
- Articles coming soon
-
- Articles coming soon
-
- Articles coming soon
- Articles coming soon
-
Communications Log Screen
Posted
Updated
ByTheta Team
Print Objective:
Explain what a user is seeing on the Communications Log Screen.
Rights Needed:
☐Admin ☒ Admin Lite ☐Well Admin ☐Well Control
☐Well Config ☐Well Config Lite ☐Read Only
Versions:
XSPOC: 3.1, 3.2
Purpose:
The Communications Log allows an Administrator to watch data traffic on a single channel or a single node to troubleshoot and identify problems in communications.
Instruction:

- Open XPOC Client
- From the navigation panel locate and select the Tools Tab
- Click Tools Tab > Communications Log Button
- The Communications Log displays the following:
- The Tool Bar along the top contains:
- Blue Triangle – starts the log
- Red Box – stops the log and will preserve the screen data until the log is started again or it is closed.
- Asset (Port) – dropdown pick list of assets and the PortID that the asset is on.
- Port – drop down pick list of available PortID’s to monitor
- Verbosity – Drop-down pick list to change the log’s verbosity
- Low
- Medium
- High
- Advanced
- On the bottom right there are two window control icons.
- The lock icon allows the user to lock the screen.
- The arrow icon allows the use to float the window and move it to other screens or areas of the same computer screen.
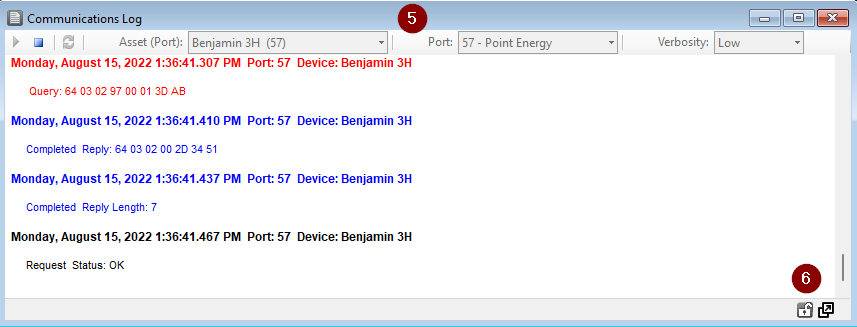
Table of Contents