
How can we help?
-
Asset
-
-
- Articles coming soon
-
- Articles coming soon
-
Facilities
-
Failures
-
- Articles coming soon
-
-
Group
-
Help
-
- Articles coming soon
-
- Articles coming soon
-
- Articles coming soon
-
- Articles coming soon
- Articles coming soon
-
-
Main Client Window
-
- Articles coming soon
-
- Articles coming soon
-
- Articles coming soon
-
- Articles coming soon
-
-
Scoreboard
-
- Articles coming soon
-
- Articles coming soon
-
- Articles coming soon
-
- Articles coming soon
-
-
Tools
-
-
- Articles coming soon
-
-
Window
-
- Articles coming soon
-
- Articles coming soon
-
- Articles coming soon
- Articles coming soon
-
Analytics Screen
Posted
Updated
ByTheta Team
Print Objective:
Explain what a user is seeing on the Analytics Overview Screen.
Rights Needed:
☐Admin ☐ Admin Lite ☐Well Admin ☐Well Control
☐Well Config ☐Well Config Lite ☒Read Only
Versions:
XSPOC: 3.1, 3.2
Purpose:
The Analytics Overview Screen displays default XSPOC analytical data
Instruction:

- Open the XPOC Client
- From the navigation panel locate and select the Group Tab
- Click Group Tab > Analytics Overview Icon
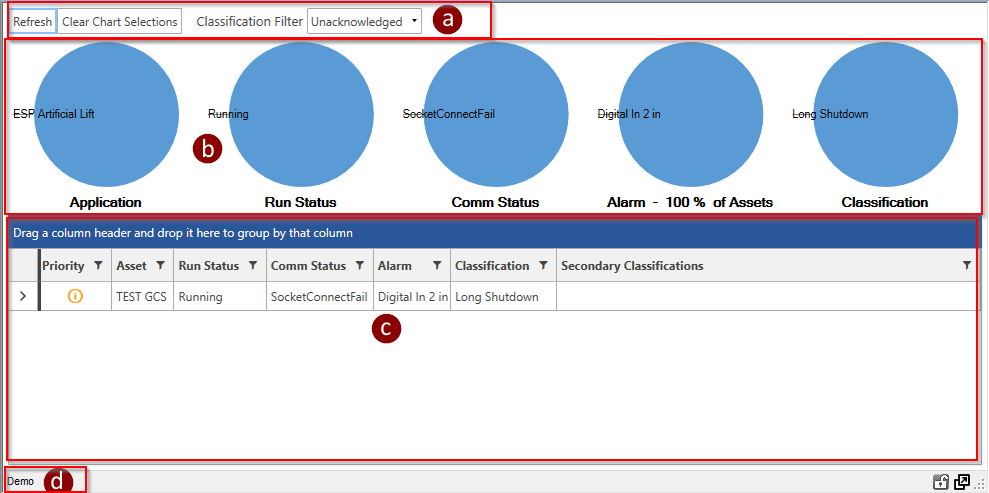
- The Analytics Overview Screen opens and displays the following:
- Window actions along the top of the screen
- Refresh – updates the data displayed on the screen
- Clear Chart Selections – sets the window back to the default configuration
- Classification Filter – allows the user to display data by classification
- Unacknowledged
- Active
- Suppressed
- All
- Pie charts along the top of the screen:
- Application Types
- Run Status
- Comm Status
- Alarm
- Classification
- The center of the screen displays analytical data for each asset in the group
- The bottom left displays the currently selected asset in the group
- Window actions along the top of the screen
- On the bottom right there are two window control icons.
- The lock icon allows the user to lock the screen,
- The arrow icon allows the use to float the window and move it to other screens or areas of the same computer screen.
Table of Contents